We at MuscleSound® are rearing up for Spring Training and excited for the 2015 MLB season. As we work to decrease soft-tissue injuries, we asked ourselves, how many soft-tissue injuries were there in the 2014 season? How does that compare to 2013 and 2012? Take a look at the total number of soft-tissue injuries in the MLB below between seasons.
| Injured Muscle | 2012 Season | 2013 Season | 2014 Season |
|---|---|---|---|
| Hamstring | 30 | 38 | 49 |
| Oblique | 27 | 29 | 24 |
| Groin | 16 | 14 | 13 |
| Quadriceps | 18 | 12 | 12 |
| Calf | 9 | 10 | 9 |
| Total | 90 | 103 | 107 |
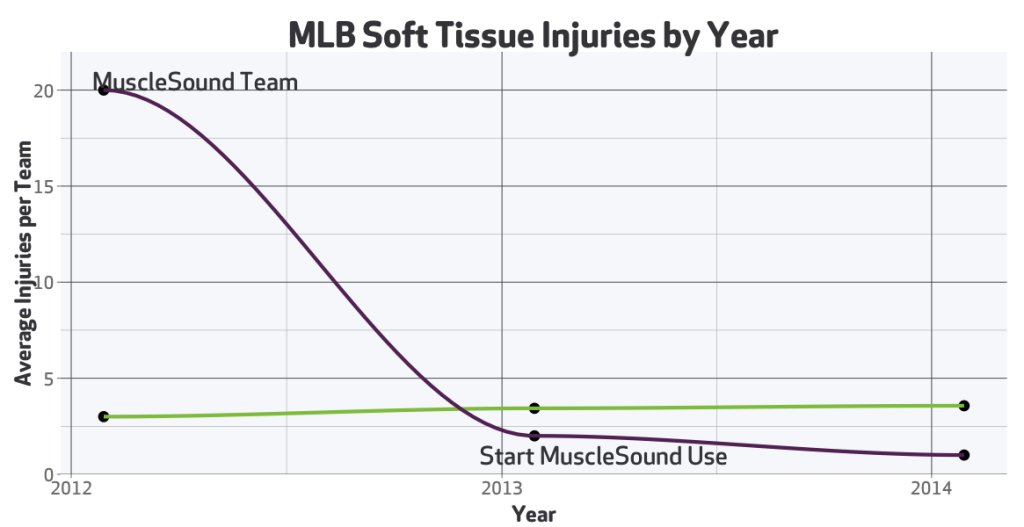
It is interesting to note that even though we live in an era of ever-evolving technology, especially in athletics, there is still a consistent trend showing the prevalence of soft tissue injuries. MuscleSound is here to change this. Our science is proven and our results are real. Just take a look below at one of the MLB teams we have partnered with. This team has significantly dropped their number of soft-tissue injuries since using MuscleSound. Today, they are well below the average number of injuries in the MLB.

Before MuscleSound, this MLB team averaged 20 soft tissue injuries per year, equating to over $20 million in salaries paid to injured players. With MuscleSound, this team had a total of 3 soft tissue injuries in 2 seasons, equating to less than $3 million in salaries paid to injured players. With MuscleSound patented technology, we can predict and therefore prevent soft tissue injuries before they happen, optimize athletic performance, and when injuries do occur, accelerate the recovery process.
We are changing the game.
