Glycogen values highlight biomechanical variances in world-class athletes.
MuscleSound® data from pre and post-workout muscle scans can highlight significant glycogen depletion differences in world-class athletes. The following graph shows an example of MuscleSound scores that emphasize biomechanical differences in a U.S. Olympic marathoner. The data illustrates pre and post-exertion scores that highlight significant glycogen depletion differences between the athlete’s right and left legs. Since this accomplished runner has competed at the highest level in her sport, these results were puzzling, as one would expect the movement in both of her legs to be extremely efficient.
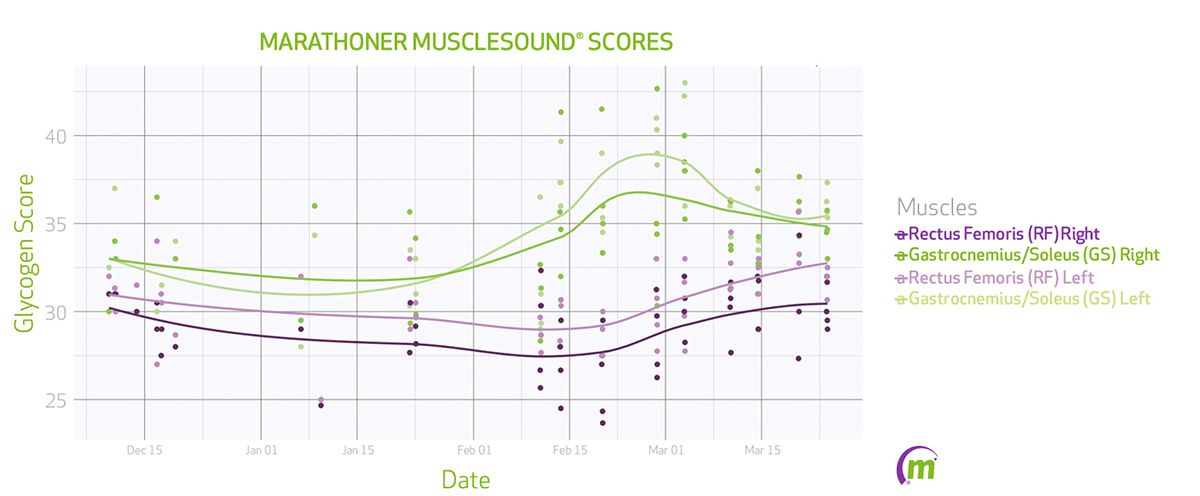
The above graph shows all of the MuscleSound data collected on this athlete. Historically, there has been a significant difference of scores between her right rectus femoris (RF) muscle and her left RF. Additionally, from approximately mid-point on the graph, the trajectory of her gastrocnemius soleus muscle (GS) values cross over and clearly show greater glycogen depletion in her right GS than her left GS. This crossover could be an indication of further deterioration of the muscular imbalances within her left leg. Our suspicions were confirmed when the runner shared the results of a newly taken electromyogram (EMG) test and foot plate analysis. The results showed that her left RF was not firing properly and her left glute muscle was over-activating.
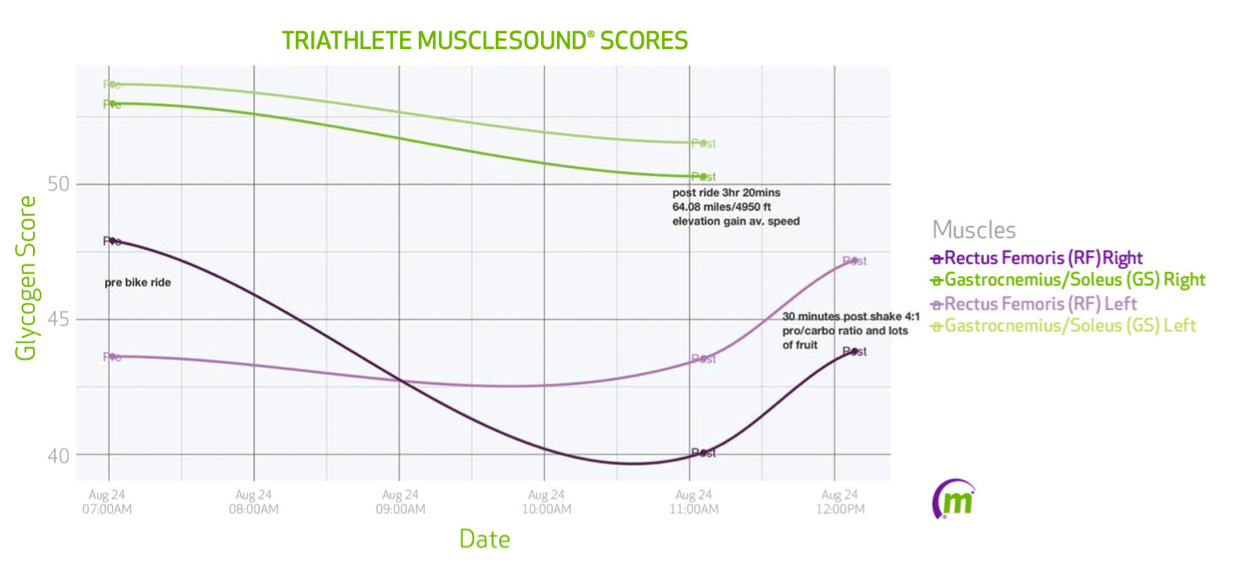
The following graph shows another example of MuscleSound scores that emphasize biomechanical differences, this time in a world-class triathlete. The data illustrates pre and post-exertion scores from the triathlete’s bike ride, where she rode 64.08 miles at an average speed of 19.11 mph and an elevation gain of 4,950 feet. Since this athlete competes at the highest level in her sport over a variety of distances, one would expect her to demonstrate a similar output of cadence/pedal efficiency in both legs. The graph below shows that the triathlete’s GS trajectories are similar, although her right leg worked harder than her left during this bike ride. More importantly, the results show that her right RF muscle experienced far greater glycogen depletion than her left RF during this bike ride.
After a consultation with the triathlete, MuscleSound learned she had previously injured her left hamstring. The biomechanical variance MuscleSound observed between her right and left legs was due to the athlete’s ongoing recovery from this injury, possibly indicating that she was still favoring her left leg during this ride.
The graph also shows the importance of re-fueling post exercise to athletes’ muscle glycogen recovery. Approximately 30 minutes after she consumed a carbohydrate/protein shake mix, there was a measurable upward trend on this athlete’s scanned RF muscles, as they started to show post-ride recovery.
These examples demonstrate the importance of the MuscleSound technology and software in allowing athletic trainers, performance coaches or sport scientists to gain crucial real-time data about their athletes’ muscle glycogen content levels during athletic exertion and recovery. It’s data that—up until now—has never been available non invasively to athletes, trainers, coaches or scientists in the field. This valuable insight not only observes the impact on an athlete’s physiology from the stress of performance and competition and highlights the benefits of nutrition pre and post exercise, but also allows trainers and coaches to determine whether or not their athletes have recovered and are able to handle the next scheduled training load.
MuscleSound allows trainers and coaches to look outside the box to determine the current state of play of their individual athletes and teams by analyzing their athletes’ biomechanical variances and modifying their exertion, rest and nutrition recommendations for enhanced muscle recovery to prevent serious injuries that could keep them out of the race or game for an extended period.